In this Section:-
1) Interpreting the Ionogram
2) NVIS Operation
3) The G4HOL Loop
4) 5 MHz Operation
5) Design Electronics
6) HF/VHF DX Resources
7) The Mysteries of the 5MHz Band
8) 160 metre Band Propagation Over a 24 Hour Period
9) Antennas for 160 metres
10) Setting up Digital voice
11) All things ferrite
3) The G4HOL Loop
4) 5 MHz Operation
5) Design Electronics
6) HF/VHF DX Resources
7) The Mysteries of the 5MHz Band
8) 160 metre Band Propagation Over a 24 Hour Period
9) Antennas for 160 metres
10) Setting up Digital voice
11) All things ferrite
The Ionogram is derived from a wide frequency sweep transmitted from an Ionosonde vertically upwards at the ionosphere and a plot of the time taken for the signal to return to earth is measured thus giving the height of the layer reflecting it. Effectively the Ionosonde is like radar as it works on a similar principle. Sweeps are taken every 5 minutes and so the Ionogram is updated in real-time thereby giving a true picture of of the state of the Ionosphere for the given time of day. The effects of a sudden Ionospheric disturbance such as a CME will be immediately noticed.
 Fig.1 A typical Ionogram
The Y-axis (vertical) is Height in Km and the X-axis (horizontal is the Frequency in MHz
Where a frequency is reflected back to earth, a pink dot is placed on the graph. These dots eventually form a line which will become almost vertical at the point where the Critical Frequency is reached. The green line is a trace of the extraordinary mode where the magnetic field has an additional effect and reflection occurs at a slightly higher than the ordinary wave by half of the electron gyrofrequency. Would this be the reason why horizontal polarisation gives slightly better results for DX operation? Occasionally an image of the plot may be found at 2 x the height of the original plot. This is an indication of a double-hop where the signal returned to earth bounces back up and is reflected back and measured a second time and hence the plot measured at 2 x the height - See Fig.2 Note that the trace is weaker showing the attenuation of the signal after reflection from the earth's surface.

Fig 2 Ionogram showing the image of a double-hop note the 2nd pink line starting at 450 metres on the graph
Click here for a definition of each parameter listed in the left-hand column.
There are a number of useful parameters that can be found at a glance in Fig 1 Ionogram
The Critical Frequency Fo, the highest frequency that will be returned to earth before passing straight through the Layer. As can be seen in the graph above, the Critical Frequency of the F2 Layer, FoF2 derived from this Ionogram is 5.625 MHz. The FoF1 and the FoE are also noted in the left-hand column.
The height of the Layer may also be found on the left-hand Y-axis.
D-Layer absorption is apparent by the lack of reflection as shown by a clear space between 1 and 2 MHz. As the frequency is increased beyond 2 MHz the signal penetrates and passes through the D-Layer.
The Maximum Usable Frequency, MUF is also calculated. In this case, the MUF is 17.12 MHz.
A useful set of parameters are located beneath the Ionogram - Distance vs Frequency.
It is possible to see Sporadic E, Es, forming on the graph which makes it possible to see enhanced conditions building up on bands from 10 metres and upwards.
In this diagram, it will be noted that to reach 3,000 Km, is would be prudent to use 17.1 MHz. The 20-metre band would yield a lesser distance as it falls between the 1,500 Km for 10.9 MHz and 3,000 Km for 17 MHz. This parameter is based on the fact that the angle of penetration of the layer will result in further distance and of course, the further the signal travels through the Ionospheric Layer the higher the frequency that may be used. The lower the angle of penetration the further the distance covered. See Fig.3.

Fig. 3 Diagram showing the angle of penetration and the consequent increase in distance travelled
It is obvious that the Ionogram is far superior to the use of propagation prediction tables based on sunspot predictions for the month. VOACAP is another propagation prediction program based on the daily sunspot number but remember, it is only a prediction program and does not give real-time results. The Ionogram gives an "at the glance" view of conditions in real-time which includes Layer Height, Critical Frequencies and Maximum usable Frequency - something that a prediction program cannot achieve. As there is no Ionosonde running in Ireland it is probably wise to take the readings from the UK Solar Data Centre website for the state of the Ionosphere in the vicinity of Ireland.
---oo00O00oo---
NVIS Operation


NVIS Operation
Near Vertical Incidence Sky-wave, NVIS, is a propagation mode that utilises high angle radiation to send a signal vertically upwards to be reflected back to earth via the ionosphere for effective short to medium range communications. The antenna has to be designed to radiate signals vertically and the frequency chosen approximately 10% below the Critical Frequency to facilitate reliable Omni-directional communications over a radius of 200 miles at most. This mode of operation makes NVIS ideal for National and Localised communication during disasters or other emergency situations.
Using NVIS Successfully
To achieve a reliable communications path in a circle of 200 miles one has to be able to radiate a signal, from the antenna at a typical angle of 60 - 90 degrees. This will fill in the skip or dead zone where the ground wave reception ceases to the point where sky-wave returns to earth see Fig. 1

Fig. 1 Propagation of Radio Waves
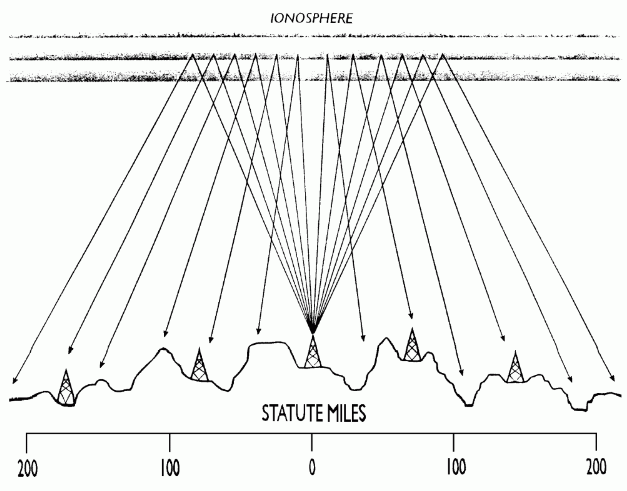
Fig. 2 NVIS Propagation
All of the antennas previously be used may be used in the field. Another rapidly deployable portable antenna would be a slanted 8-metre fibreglass pole attached to the back of the vehicle. 33ft of wire is wrapped along the length of the pole and fed at the bottom via an ATU. A set of counterpoise wires, 5% longer than a 1/4 wavelength of the frequency in use, can be located beneath the antenna. Good reports have been reported with this arrangement. See illustration below.

G4HOL Loop Antenna
Fig.2 shows the ideal propagation of the radio signal for NVIS operation. To achieve a near-vertical radiation from the antenna it is necessary to locate the antenna < 1/4, at the frequency in use, above ground.
Choice of Frequency:
During the daytime, 40 metres is the highest frequency band used, by afternoon and evening a middle band such as 60 metres, and a lower frequency such as 80 metres would be used at night. 160 metres could be used in the winter months during the night. The Critical Frequency, Fo, is the key to the successful operation of NVIS. Ideally, a frequency of 10% than the Critical Frequency should be used. The Ionogram can be checked for a suitable choice of Frequency. The FoF2 should be noted.
Choice of Antenna:
The antenna can be a dipole, an Inverted Vee, or a pair of phased dipoles (Shirley Antenna) located at no more than 1/4 wavelength above ground. Better again try the G4 HOL antenna as shown on this page. All of the above will work well and can be enhanced with a counterpoise of 5% longer placed beneath them if the earth conductivity is poor.
Vertical antennas are not suitable for NVIS for obvious reasons.
Vertical antennas are not suitable for NVIS for obvious reasons.
Moblie Operation:
A resonant antenna drawn diagonally across the roof of the vehicle, as seen in Military usage, will give good results. There are Commercial Loop antennas available that use the roof rack as a ground plane. These are quite expensive and not generally used by Amateurs.


Portable Operation:
All of the antennas previously be used may be used in the field. Another rapidly deployable portable antenna would be a slanted 8-metre fibreglass pole attached to the back of the vehicle. 33ft of wire is wrapped along the length of the pole and fed at the bottom via an ATU. A set of counterpoise wires, 5% longer than a 1/4 wavelength of the frequency in use, can be located beneath the antenna. Good reports have been reported with this arrangement. See illustration below.

In conclusion, NVIS will cover the area which is normally located within the dead or Skip Zone. NVIS antennas are easy to erect by one person. The path to the Ionosphere is short and direct, resulting in lower path losses due to factors such as D-Layer absorption. Low lying areas and valleys are easily reached using NVIS Propagation. NVIS requires no infrastructure such as repeaters or satellites. Two stations employing NVIS can establish reliable communication without the support of a third party.
Members of the Galway VHF Group will be performing some experiments using NVIS techniques on the LF bands 160 - 40 metres. It is hoped that the results will aid the Amateur Radio Emergency Network activities carried out over the following year.
---oo00O00oo---
The G4HOL Loop antenna is an excellent multi-band and Omni-directional antenna giving relatively quiet reception due to the fact that it is a full-wave loop. An 80metre band loop will work well on all bands HF with a tuner in line. If situated horizontally and just 20ft above ground, the Loop will give good NVIS results resulting in operation within Ireland or from Ireland to the UK. It is inexpensive to make with the major cost being the balanced feeder.
The 40metre version of this antenna was in use for several years at the EI5DD QTH. When the band characteristics were poor using a dipole or vertical antenna, the Loop produced excellent results with very little band or atmospheric noise. Consistent results into the IRTS news, read from Dublin and received in Galway, were achieved with strong signal reports received in both directions.
Obviously, the higher the antenna is suspended above group, the lower the angle of radiation. For more DX characteristics it would be necessary to place the antenna at a greater height of at least 66ft.
The dimensions for different fundamental frequencies are shown in the diagram below.

Modelling the antenna through the EZ-NEC program shows an interesting graph of resonant points across the HF frequency spectrum.

The graph above shows the peaks of resonance across the HF Frequency Spectrum and all that is required is an ATU to match to 50-ohm unbalanced coaxial cable.

Looking at the antenna sideways on shows the main lobe of power from the antenna at 20ft above ground.

This plot is a 3D plot of radiation from the antenna. Naturally, the antenna will become less effective as an NVIS antenna as the frequency increases, although at 20 ft above the ground it is not going to change in characteristics too much.
Those interested in using this antenna for 5 MHz operation could try a loop made from 188 ft of wire in a square or rectangular configuration as in the first illustration.
Don't expect this antenna to work on 80 metres during the middle of the day due to D-Layer absorption. To find the best frequency for NVIS operation checks the Latest Ionogram. D-Layer absorption begins to take effect just after sunrise and 80metres will get progressively worse before midday. 40metres will generally give better results throughout the day but will become more DXish as the evening draws near.
In case the dimensions are not too clear the Loop sizes are as follows:
160 - 10 metres ------------- 566ft (172.5m) Circumference
80 - 10 metres ------------- 283ft (86.25m) Circumference
40 - 10 metres ------------- 141ft 6 ins (43.13m) Circumference
60 - metres try 188ft (57m) Circumference
---oo00O00oo---
5 MHz Operation click here
---oo00O00oo---
Design Electronics click here
---oo00O00oo---
HF/VHF Dx Resources click here
---oo00O00oo---
The Mysteries of the 5 MHz Band click here
Design Electronics click here
---oo00O00oo---
HF/VHF Dx Resources click here
---oo00O00oo---
The Mysteries of the 5 MHz Band click here
---oo00O00oo---
160 metre Band Propagation Over a 24 Hour Period click here
---oo00O00oo---
Antennas for 160 metres Click here
---oo00O00oo---
Setting up Digital Voice Click here
---oo00O00oo---
All Things Ferrite click here
---oo00O00oo---
160 metre Band Propagation Over a 24 Hour Period click here
---oo00O00oo---
Antennas for 160 metres Click here
---oo00O00oo---
Setting up Digital Voice Click here
---oo00O00oo---
All Things Ferrite click here
---oo00O00oo---


